Every March, as the fiscal year draws to a close, Local Authorities (LAs) across the UK race to secure their borrowing needs. This concentration in borrowing activity creates ripple effects across local government debt markets, raising LA-to-LA borrowing costs and tightening liquidity.
The Public Sector Net Cash Requirement (PSNCR) is a measure that assesses the government’s short-term borrowing needs, including the needs of central government, local authorities, public corporations, and other public sector entities. While Local Authorities contribute a smaller portion to the overall PSNCR compared to central government, both exhibit seasonal borrowing trends. Notably, there is a pattern of increased borrowing toward the fiscal year-end. By examining these patterns – particularly the pronounced peaks at fiscal year-end – we better understand the challenges that LAs face and how they affect public sector borrowing conditions.


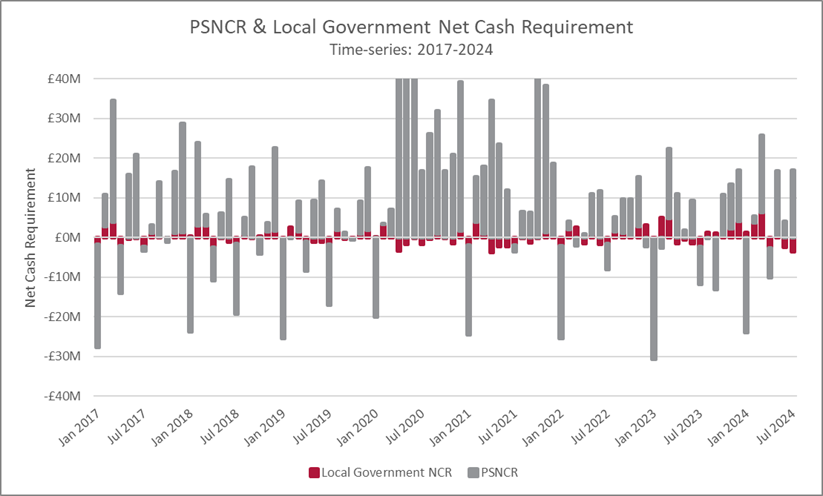
Source: Office for National Statistics, (1) PS: Net Cash requirement (exc PS Banks) (PSNCR exc): £m CPNSA (2) LG: Net cash requirement: £m CPNSA
As shown in the first graph, the net cash requirement of local governments represents only a small portion of the overall fiscal surplus or shortfall. This is expected, given that central government, with its already significantly larger budget, can borrow to cover day-to-day spending, allowing it to sustain greater deficits. In contrast, local authorities are more constrained because they can only borrow for capital expenditure, not for day-to-day operational spending. Moreover, while central government spending is influenced by various economic and political factors, the pronounced seasonal trends in local government net positions are primarily due to the timing of income, such as grants and tax receipts.
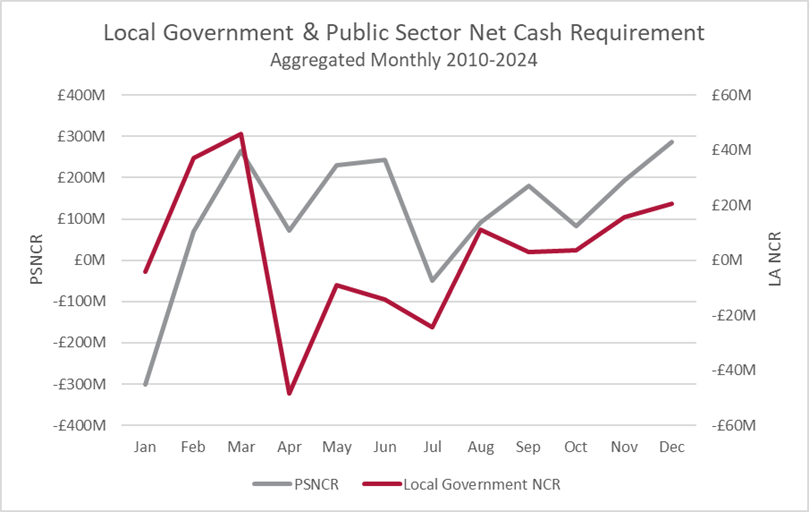
Aggregated monthly data shows that local governments’ net cash requirement peaks in March, followed by consistent surpluses until August, after which the cash requirement gradually increases throughout the rest of the year.
These seasonal borrowing patterns, particularly the pronounced peak in March, are driven by several factors related to the fiscal year-end. As local authorities approach March 31, they settle outstanding liabilities such as invoices, grants, and final payments for capital projects, leading to significant cash outflows. At the same time, income streams tend to be front loaded towards the start of the year, such as grant funding from central government. Similarly, council tax payments typically decline in March since they are still largely collected over the ten months to January, resulting in reduced cash inflows in the last two months of the financial year. This combination of increased expenditures and decreased revenues intensifies the net cash requirement during this period, driving up demand for borrowing from sources like the PWLB and inter-authority lending markets.

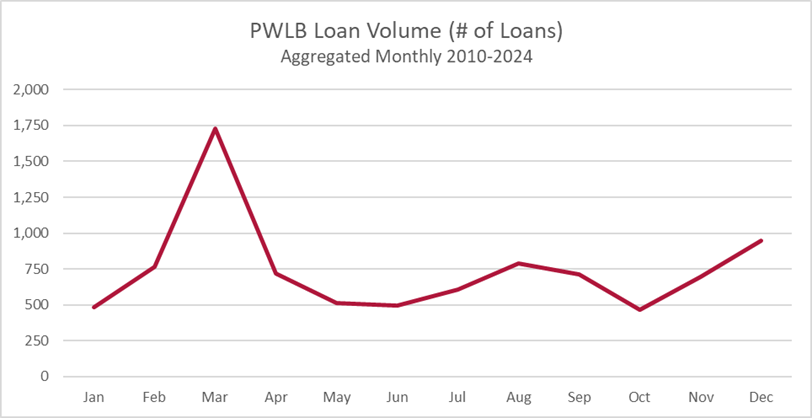
Source: DMO, PWLB Lending Facility, Historical Data, Monthly Loans Report (Link)

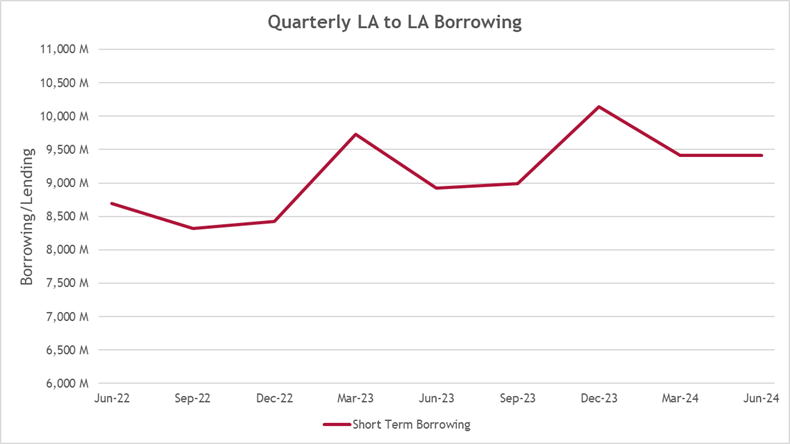
Source: GOV.UK, Live Tables on local government finance (Link)
As seen above, aggregated monthly PWLB borrowing (2010-2024) peaks significantly in March, reflecting the high cash requirements of local authorities at the end of the fiscal year. However, not all borrowing is done through the PWLB. While the PWLB has a statutory lending limit set at £115 bn, cumulative PWLB lending amounted to £92.3 billion in March 2024. This indicates that PWLB borrowing approached but did not hit the statutory limit, demonstrating its capacity to handle a surge in demand without causing a harmful liquidity problem. Nevertheless, there are several reasons why local authorities prefer borrowing from other local authorities. Local authorities often secure more competitive interest rates, enjoy greater flexibility in loan terms, and benefit from quicker approval processes when borrowing from peers. In this way, we can also see the March effect in the LA-to-LA market (graph 4). Unfortunately, unlike the PWLB, the inter-authority lending market is affected by liquidity shortages. This was evident this past March, when a spike in LA borrowing demand caused liquidity to deteriorate and elevated borrowing rates over 7%.
To mitigate the effects of such market turbulence, local authorities can adopt practical strategies and engage in proactive planning. Enhancing cash flow forecasting allows LAs to anticipate funding needs more accurately, enabling them to spread borrowing more evenly throughout the year rather than concentrating it in March. Proactive financial planning, including early identification of upcoming expenses and revenue shortfalls, can help minimise exposure to elevated interest rates in the LA market around year end. Looking ahead, these borrowing patterns may evolve due to changes in economic conditions or shifts in LA planning. By implementing strategic financial management practices, LAs can ensure sustainable fiscal health and contribute to a more stable financial environment for all local authorities.
For more information, or assistance with cash flow forecasting or debt scheduling, please contact us at info@arlingclose.com or on 08448 808 200.
Related Insights