UK gilt yields have recently risen as investors price out the prospect of extensive monetary policy loosening in both the UK and the US. The fiscal-fuelled US economy has looked very resilient in the face of tighter monetary policy, despite the surprise slower GDP growth in Q1 2024, and this resilience in activity is prolonging above-target inflation. UK activity indicators have also picked up since the start of the year, while inflation did not fall quite as sharply as expected for March, amid upside risks such as higher shipping, energy and commodity costs. Meanwhile, in contrast, policymakers in the Eurozone have set up a June policy rate cut, due to the weakening economic environment and seemingly subdued inflation.
Governor Bailey of the Bank of England made the recent point that he thinks the UK’s outlook for inflation and growth has more in common with the Eurozone rather than the US. The comment was largely interpreted as an attempt to reduce the close correlation between UK and (the upwardly mobile) US government bond yields.
10-year government bond yields (source: Bloomberg)

But is the path of UK inflation similar to that of either the Eurozone or the US? Following Bailey’s comments, other Bank of England policymakers were quick to suggest that cuts in Bank Rate were some way off, seemingly more in line with the market’s more cautious stance on monetary easing in the US.
The following (left-hand) chart shows headline inflation measures from the Eurozone, UK and US since January 2022. It certainly suggests that the Eurozone and US are in a much better position inflation-wise than the UK and have been for some time. The US measure has recently been edging up rather than continuing down to the Federal Reserve’s 2% target.
12-month inflation rates (source: ONS, Eurostat, BEA)


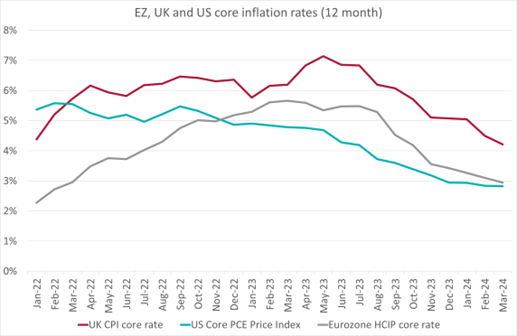
The headline rate only tells part of the story, but the underlying core rates are not too dissimilar. In the chart on the right, the Eurozone core rate appears to be on a downward trend, whereas the decline in the US rate has again stalled. The UK core CPI rate has been falling in fits and starts, certainly giving the impression that a 2%-consistent level is more distant.
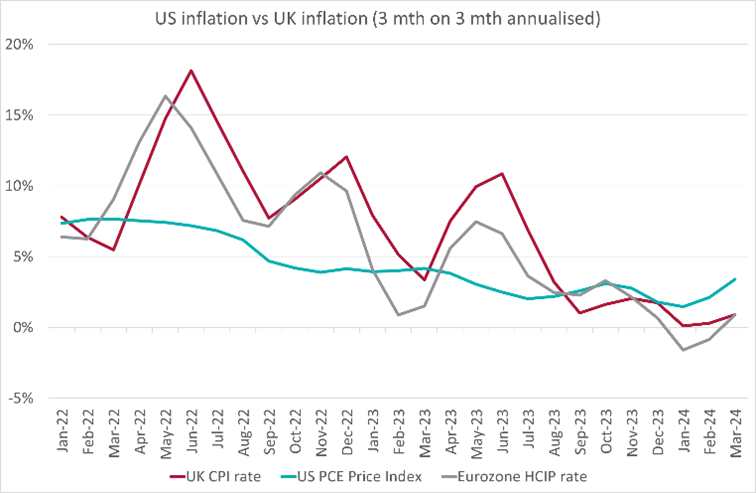
However, the volatility of inflation means that we have to look beyond the 12-month rates to understand the developing situation. Shorter-term trends help us assess the more recent inflation picture. The following charts show the three-month-on-three-month annualised rate, for each country, for headline and core.
3-month on 3-month annualised inflation rates (source: ONS, Eurostat, BEA)


These latter charts tell a very different story, one in which headline UK inflation has remained subdued for some time, while the core rate has cooled rapidly over the past few months. The UK rates are following a trend set by the Eurozone, albeit the Eurozone rates have picked up a little more recently. The US picture is markedly different, with headline and core rates both seemingly accelerating, again supporting the uncertain view around inflation and monetary policy that is driving investor behaviour.
The data on inflation certainly supports the Governor’s stance on UK inflation being closer to the Eurozone rather than the US, suggesting investors should be treating the policy rate paths differently. Although UK growth appears to have picked up a little in Q1 2024, it still appears below trend and certainly not likely to be particularly inflationary. The UK core and services inflation rates are too high at 4.2% and 6% respectively, but both are likely to fall in a below-trend growth environment.
At Arlingclose we believe that current gilt yields represent a higher path for Bank Rate than is likely given the UK’s growth and inflation outlook. While there are upside risks to inflation arising from geopolitical events, the disinflationary trend in the UK has further to run, and we therefore expect yields to fall later this year.
If you’d like to find out more about Arlingclose’s forecasting and economic services, please get in touch.
Related Insights